Audemic business growth: A loyal B2C base, and nowhere to grow
Heading into the next funding round, investors wanted to know how Scholar would scale. The problem was the customer lifecycle. Its loyal users were undergraduate and graduate students, so every user it won came with a leaving date. Growth had to come from someone else who reads research for a living, and who'd pay for it.
Role: Senior Product Designer & Product Manager
Contribution: Product design, Product strategy, Discovery research, Journey mapping, Growth experiments, Roadmap prioritization
Audemic Scholar is a web app that lets university students listen to full-text research papers and reports. Since 2022 it had built a loyal B2C user base and was making $8,000 a month.
Investors doubted it could scale, because undergraduate and graduate students only stay users until they graduate.
The user need was tools that cut the workload of finding and organizing information. The business need was a new market, found from what we already knew about our users, and a clear ideal customer profile. Early hypotheses pointed at the social sciences, because 60% of Scholar users came from that field.
Both roll up into one product vision. Give professionals in fast-paced industries quicker access to critical information, so they spend their time on the work that has impact.
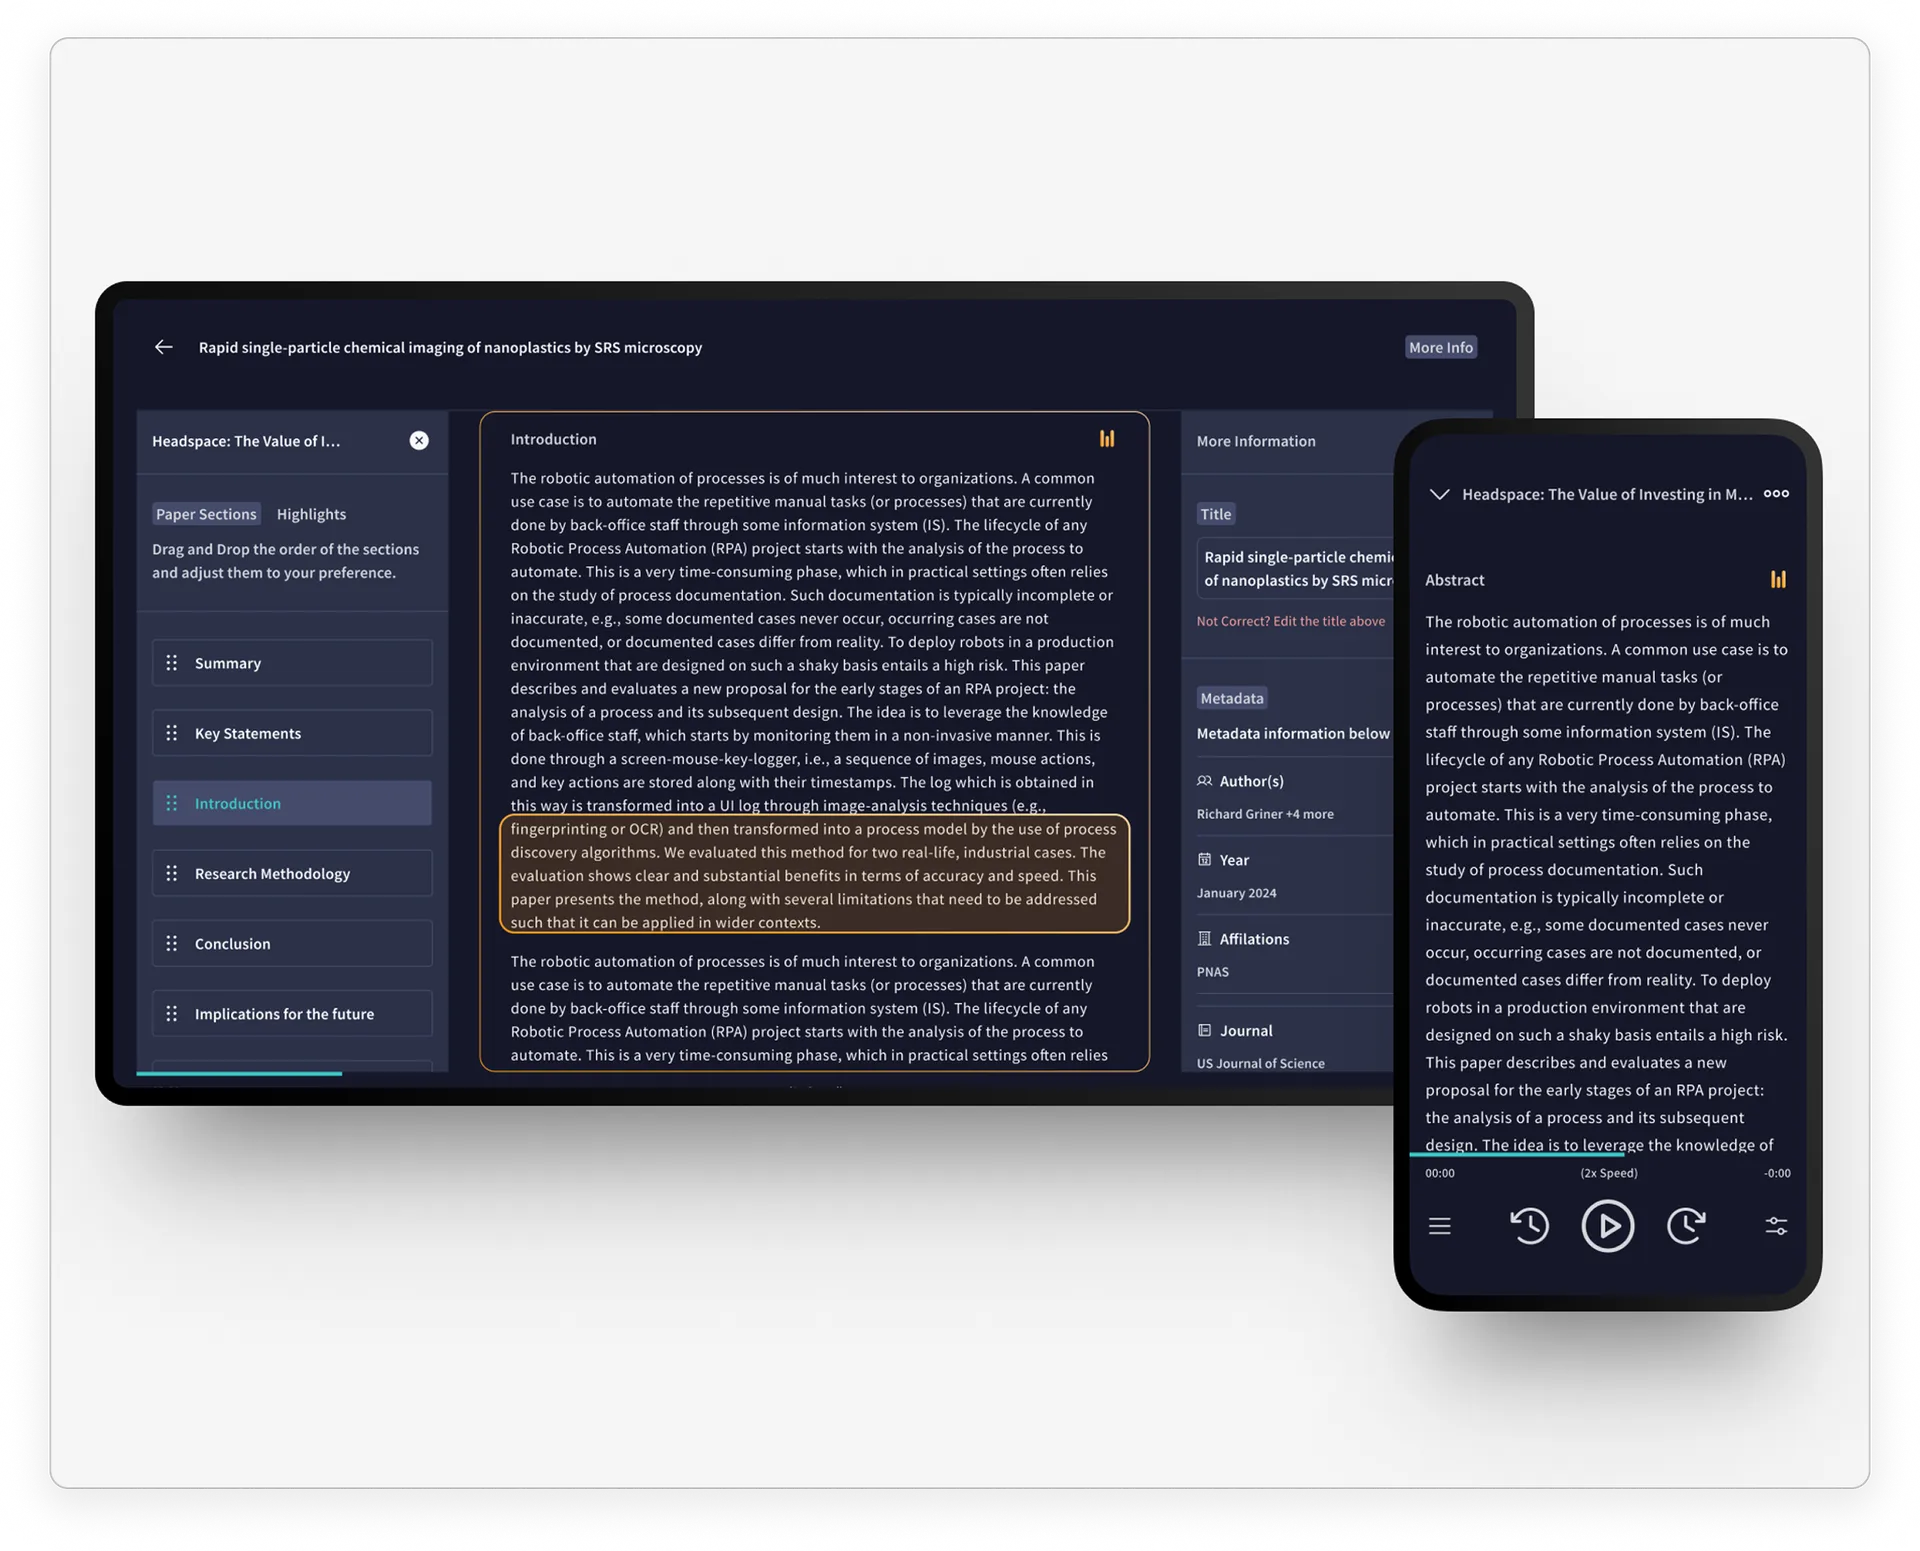
Three changes came out of it. First, AI summaries, iterated across OpenAI and Claude models with survey and interview feedback between rounds. Second, a redesigned paper view that puts the summary on top of the full text, so a researcher can understand new work without reading all of it. Third, in-app feedback that collects insight quietly instead of stopping someone mid-task to ask.
We interviewed UN analysts and vaccine researchers. Each of them loses about 20 hours a month just searching for information. At the scale of an organization like NIH, that's close to $10 million a month in lost productivity.
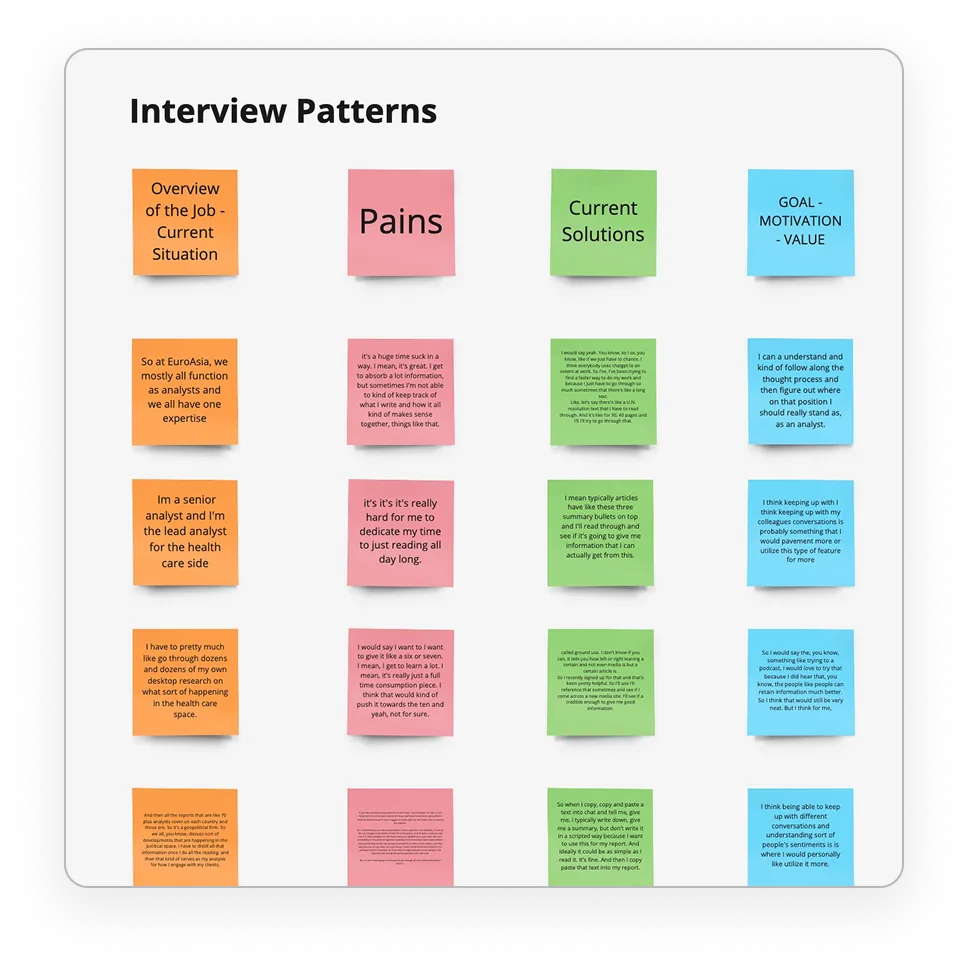
We sorted every interview into four columns covering the job as it stands, the pains, the current workarounds, and the motivation underneath. The pattern only shows up when you read one column straight down.
Once we'd mapped how researchers work today, we launched a beta of a 24/7 junior analyst that keeps them up to date. Paid ads brought in 20 quality leads in the first week.
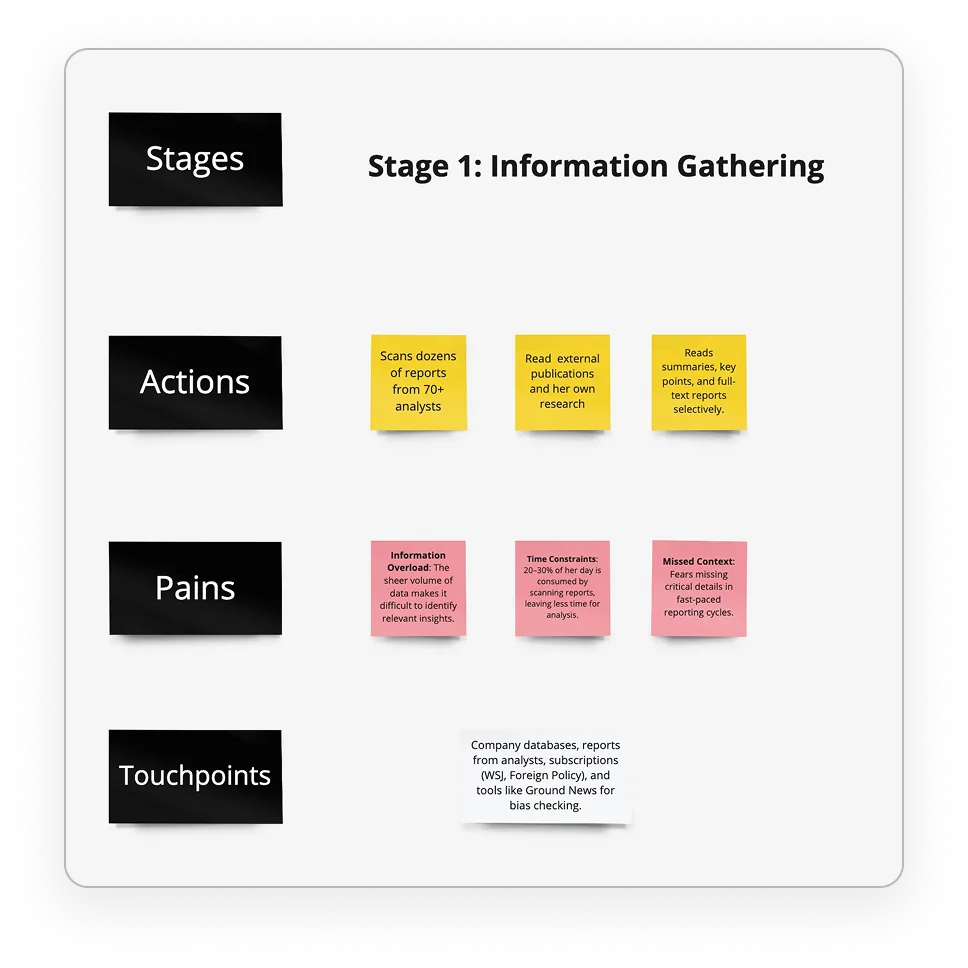
The first stage of the journey is where the time goes. Researchers scan dozens of reports from more than 70 analysts, read outside publications alongside their own research, and skim summaries to decide what's worth reading. That work is spread across company databases, analyst reports, subscriptions like WSJ and Foreign Policy, and Ground News for bias checks.
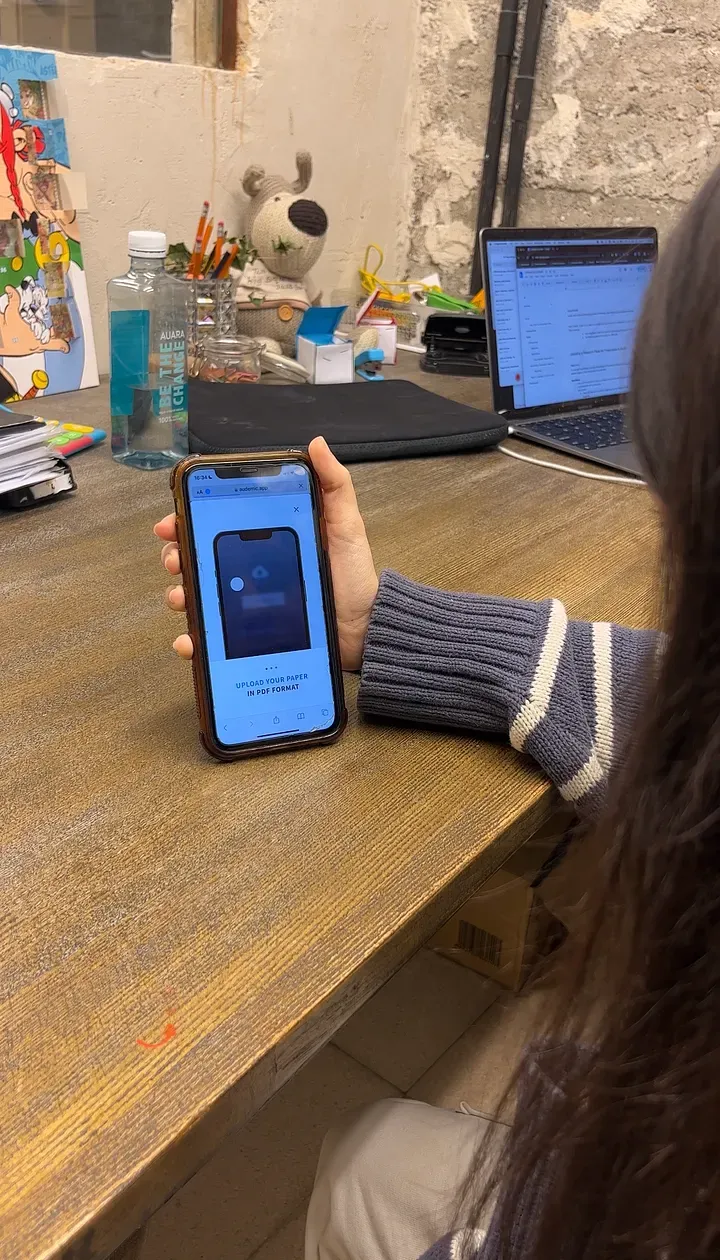
Beta users told us the summaries left out critical context, like the societal impact of a study and its effects on the groups studied. Without it, they got the gist and couldn't go any deeper.
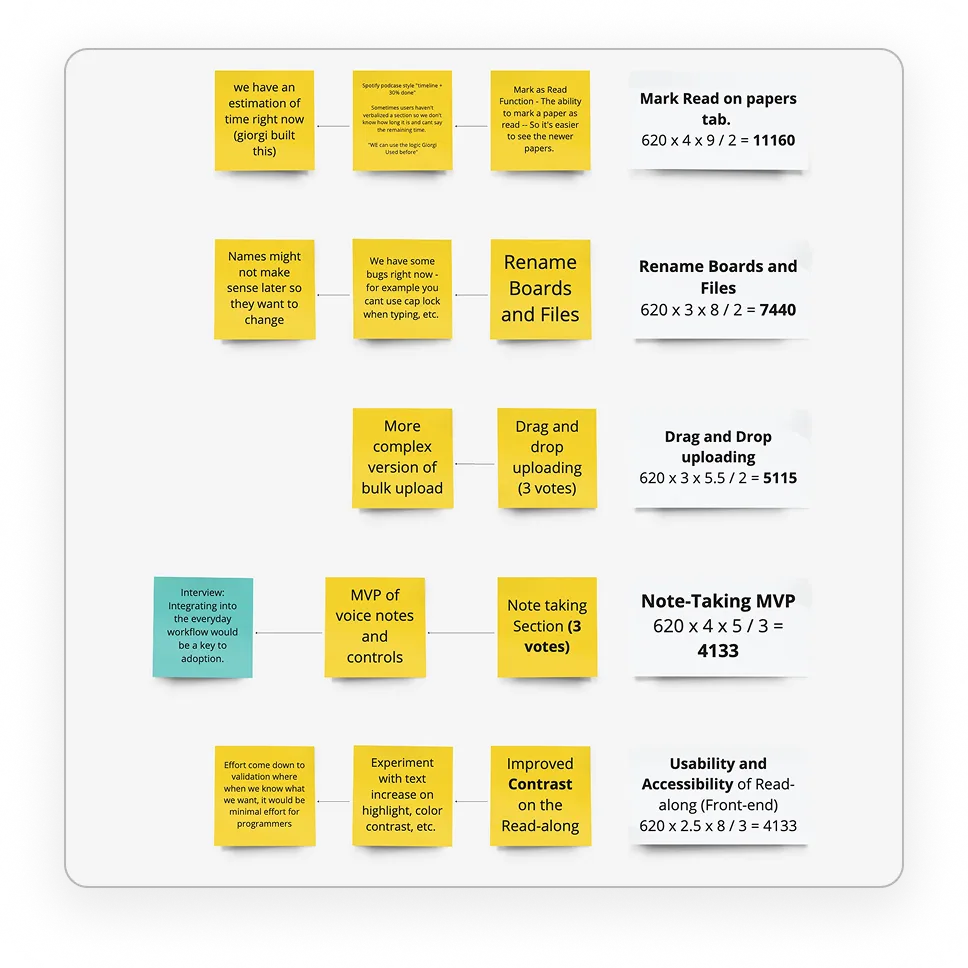
We ranked the beta users' pain points against the roadmap to get the product ready for B2B clients. Each one got a score of Reach × Impact × Confidence ÷ Effort.
Marking papers as read scored 11,160, renaming boards and files 7,440, drag-and-drop upload 5,115, and the note-taking MVP 4,133. Writing the arithmetic on the sticky note is the point. Discussing whether renaming matters more than uploading goes nowhere. Discussing whether renaming really reaches all 620 students goes somewhere.